

Market Commentary - November 2026
Explore October’s market shifts, monetary policy outlook, and election implications for investors.

| Index | October 2026 (%) | YTD (%) | 1-Year (%) | 3-Year Annualized (%) |
|---|---|---|---|---|
| S&P 500 Index | (0.9) | 11.8 | 12.1 | 23.4 |
| Dow Jones Industrial Average | 1.8 | 9.1 | 10.6 | 18.2 |
| NASDAQ Composite Index | (5.3) | 10.0 | 7.9 | 26.4 |
| Russell 2000 Index | 0.6 | 14.5 | 15.0 | 20.8 |
| MSCI All Country World Index (ex U.S.) | (2.8) | 11.0 | 14.3 | 21.1 |
| MSCI Emerging Markets Index | (8.0) | 13.8 | 14.4 | 22.9 |
| U.S. Aggregate Bond Index | 2.4 | (0.5) | (0.1) | 5.5 |
Figures shown are percentage returns for the periods indicated.
October Flipped the Script
September ended with investors increasingly questioning the narrowness of market leadership. In October, that story changed dramatically. The equal-weighted S&P 500 Index posted its best relative performance versus the standard S&P 500 Index since April 2009, as many areas left behind by the market’s concentration in mega-cap growth stocks moved to the front.
The reversal was striking. Energy gained 13.9%, while Consumer Staples, Utilities, and Health Care each advanced roughly 10%. Materials rose 8.3%, and Financials, Consumer Discretionary, and Real Estate also posted solid gains. Meanwhile, Technology fell 8.3% and Communication Services declined 10.0%. The rotation helped the Dow Jones Industrial Average gain 1.8% and the Russell 2000 advance 0.6%, even as the S&P 500 fell 0.9% and the technology-heavy NASDAQ Composite declined 5.3%. October effectively turned September’s leadership on its head: Technology went from the market’s lone source of strength to one of its weakest sectors, while gains spread broadly across the rest of the market.
The broadening, however, was largely a U.S. story. International markets remained under pressure, with the MSCI All Country World Index excluding the U.S. declining 2.8% and emerging markets falling 8.0%, their fifth negative month in the past eight. Bonds provided some diversification, with the U.S. Aggregate Bond Index gaining 2.4%. Taken together, October offered the clearest challenge in some time to one of the market’s dominant themes: that investors could rely on a small group of mega-cap growth companies to carry the broader market.
One month does not establish a new regime. But after years in which capitalization-weighted indexing and concentrated leadership repeatedly rewarded investors for staying on autopilot, October raises an important question: Was this simply a sharp rotation away from crowded winners, or is the rest of the market finally beginning to catch up?
Is the Market Coming Off Autopilot?
One way to answer that question is to look beyond the headline S&P 500 Index and examine what is happening with the average stock. The equal-weighted S&P 500 Index owns the same companies as the traditional index but assigns each constituent the same weight at its quarterly rebalancing, rather than allowing the largest companies to exert the greatest influence on performance. That makes the index a useful gauge of how the average S&P 500 company is performing relative to the market’s largest constituents.
The distinction has become increasingly important. For much of the past decade, investors did not need broad participation to generate attractive returns. Strong performance from a relatively small group of very large companies was enough to propel the capitalization-weighted S&P 500 higher, even while many other companies in the index lagged. The result is visible in the chart below: equal weight’s performance relative to the capitalization-weighted index has fallen to levels rarely seen over the past two decades.
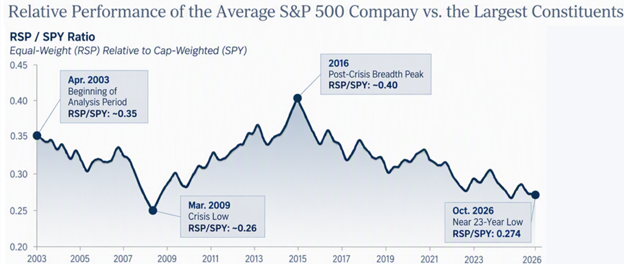
The chart also puts October’s move into perspective. Despite the dramatic improvement in breadth during the month, the average stock is starting from an unusually depressed relative position. In other words, October was significant because of where it occurred, not because one month is sufficient to declare that market leadership has changed. A sustained rise in the equal-weight-to-cap-weight relationship would provide much stronger evidence that participation is broadening and that performance is becoming less dependent on the market’s largest companies.
Broader participation could also have important implications for active management. Equal-weight outperformance alone does not necessarily make this a “stock-picker’s market.” The more important companion is dispersion, or the degree to which individual stock returns differ from one another. When breadth expands and dispersion increases, investors have both a wider opportunity set and greater separation between winners and losers, potentially creating a more favorable environment for fundamental security selection.
That is why we view October as a potential inflection point rather than confirmation of a new regime. The next test is whether the improvement in breadth persists and is joined by broader earnings growth, improving credit conditions and sustained relative momentum. If those pieces begin to align, the investment environment could become meaningfully different from the one investors have grown accustomed to: one in which owning more of yesterday’s winners may matter less and what you own may begin to matter more.
Central Banks Hit Pause, But Not Necessarily Stop
The potential change in market leadership was not the only long-standing assumption tested in October. Investors also had to reconsider the outlook for monetary policy. After several years in which the dominant question was when interest rates might come down, persistent inflation and resilient economic growth have shifted the conversation toward whether rates may need to remain higher, or even move higher, for longer.
The Federal Reserve left the federal funds rate unchanged at 3.75% to 4.00%, but the decision was hardly an all-clear on inflation. The Fed upgraded its description of economic activity to a “strong pace,” noting resilient domestic spending, robust capital investment and strong productivity growth while continuing to describe inflation as elevated. Perhaps more telling was the 10-2 vote, with two policymakers preferring a quarter-point increase. J.P. Morgan Asset Management strategist Jordan Jackson characterized the Fed as essentially “buying some time,” noting that strong growth and sticky inflation leave policymakers with the flexibility to raise rates in December or remain on hold.
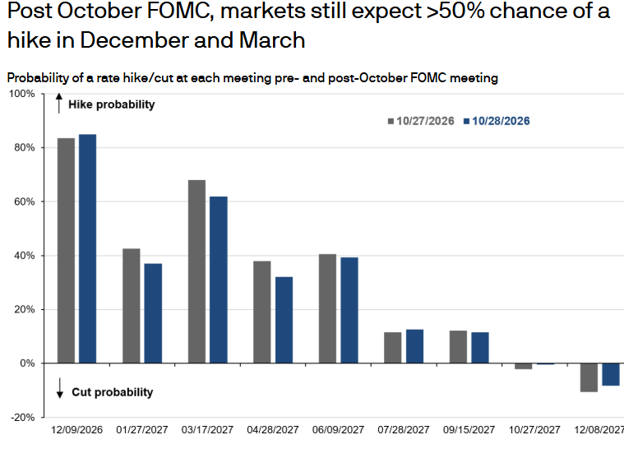
There is another side to the Fed’s dilemma. Megan Leonhardt, writing in Barron’s, points out that the labor market looks less robust beneath the surface. Hiring remained below its year-earlier pace according to LinkedIn, while the share of unemployed workers out of work for more than 27 weeks increased to 27.1% in September from 24.7% in January. That leaves the Fed navigating an increasingly narrow path: inflation argues for patience, and potentially tighter policy, while emerging softness in the labor market raises the risk that additional tightening could eventually prove unnecessary.
The Fed was hardly alone in exercising caution. In his weekly review, Mohamed El-Erian noted that the European Central Bank and Bank of Japan also left rates unchanged, while the Bank of Canada raised rates by 25 basis points and signaled that additional increases could follow. Taken together, the message from global central banks was less about what they did in October than what they were unwilling to declare: the inflation fight is not over. For markets, that suggests the monetary-policy backdrop may remain restrictive even when central banks choose not to act at any particular meeting.
The absence of a rate hike should not be confused with the return of easy money. For now, strong growth is giving central banks room to remain patient, while persistent inflation is giving them reason to do so.
Midterms: From Politics to Policy
Nearly all the votes have now been counted, and the outcome was far more decisive than most expected. Democrats won control of both the House and Senate, including Senate victories in several states that had long been considered Republican strongholds. Current projections give Democrats at least 54 Senate seats and a commanding House majority. The magnitude of the result was significant enough that The New York Times described it as potentially the Republican Party’s worst congressional defeat in roughly half a century.
The economy appears to have played a central role. The CNBC Voter Poll found that 75% of voters viewed the economy as “not so good” or “poor,” while 87% expressed concern about gasoline prices. Inflation, tariffs and the ongoing war with Iran became intertwined in voters’ minds as higher energy prices pressured household budgets and business costs. The New York Times reported that Republican polling had deteriorated as the Iran conflict intensified and improved during periods when prospects for a cease-fire increased.
For markets, however, the political result matters less than what it changes in Washington. Democratic control of Congress effectively ends the Republican legislative majority for the final two years of President Trump’s term. Major new legislation will now require compromise between a Democratic Congress and a Republican White House, increasing the likelihood of gridlock while potentially shifting more policymaking toward executive and regulatory action. Congressional oversight is also likely to increase substantially.
Several investment implications are worth watching. Artificial intelligence and the data-center buildout emerged as important election issues, particularly around electricity demand, water usage and utility costs. In Texas, where Democratic candidates captured both the Senate seat and governor’s office, the winning campaigns called for tighter rules on data-center development. Nationally, 56% of respondents to the CNBC Voter Poll described data centers as either a crucial or major factor in their vote. That does not signal an end to the AI investment cycle, but it adds another consideration to the debate over how quickly enormous capital commitments can translate into sustainable returns.
Investors should also resist the temptation to turn election results into a market forecast. Historically, markets have generally responded well once the uncertainty surrounding midterm elections has passed. CNBC reports that the S&P 500 has gained an average of 13.7% during the twelve months following midterm elections and produced positive returns in 91% of those periods. A separate Deutsche Bank analysis found positive twelve-month returns following 22 of the 24 midterm elections since 1930. History is hardly a guarantee, but the lesson is useful: elections change policy, while earnings, economic growth, inflation and interest rates ultimately determine the longer-term direction of markets.
Looking Ahead
As November unfolds, our attention turns from election results back to the fundamental forces driving markets. The final weeks of third-quarter earnings season will test whether profit growth is broadening beyond the market’s largest companies. With much of mega-cap technology already having reported, results across consumer, industrial, healthcare and technology companies should provide a clearer picture of demand, margins and pricing power. NVIDIA’s November 17 report will be particularly important to the debate over AI spending, demand and the returns being generated from extraordinary investment in computing infrastructure. Walmart, Home Depot, Target and Lowe’s should also offer useful readings on the health of the consumer later in the month.
The economic calendar will be equally important. October’s employment report arrives November 6, followed by consumer inflation on November 10, producer prices on November 13 and retail sales on November 17. The Federal Reserve will release the minutes from its October meeting on November 18, while the second estimate of third-quarter GDP and the Fed’s preferred PCE inflation measure arrive November 25. Together, these reports should clarify whether healthy economic growth can coexist with enough cooling in inflation to keep the Fed on hold.
Developments in the Iran war will remain another important variable. The conflict has demonstrated how quickly geopolitics can reach household budgets, inflation expectations and monetary policy. We will watch military activity near the Strait of Hormuz, signs of renewed negotiations and, most important for markets, the direction of oil and gasoline prices. The United States conducted strikes against targets on Qeshm Island shortly before the election, although President Trump subsequently said there were no immediate plans for another round. With regular gasoline recently above $4 per gallon, energy prices have implications for consumer spending, inflation, corporate margins and future Federal Reserve decisions.
Finally, we will be watching whether October’s change in market leadership has staying power. One month of stronger equal-weight performance does not establish a new regime, but continued participation from a broader range of stocks, accompanied by improving earnings breadth and supportive credit conditions, would strengthen the case that the investment opportunity set is widening. That would be an encouraging development after years in which returns became increasingly dependent on a relatively small number of very large companies.
There is no shortage of uncertainty as we approach year-end, but uncertainty and opportunity are rarely far apart. Rather than trying to anticipate every turn in Washington, the Middle East or monetary policy, we remain focused on what the incoming information tells us about earnings, inflation, interest rates and the health of the economy. Those fundamentals, rather than any single election, earnings report or geopolitical headline, remain the foundation of our long-term investment decisions.
Thank you for your continued confidence in our team, and please reach out with any questions you may have. It is our pleasure to share life’s journey with you.
Index Definitions
Dow Jones Industrial Average: The Dow Jones Industrial Average is a price-weighted average of 30 blue-chip stocks that are generally leaders in their industries. It has been a widely followed indicator of the stock market since October 1, 1928.
NASDAQ Composite Index: The NASDAQ Composite Index is a broad-based capitalization-weighted index of stocks in all three NASDAQ tiers: Global Select, Global Market and Capital Market. The index was developed with a base level of 100 as of February 5, 1971.
Russell 2000 Index: The Russell 2000 Index comprises the smallest 2,000 companies in the Russell 3000 Index and represents approximately 8% of the Russell 3000’s total market capitalization. The real-time value is calculated with a base value of 135.00 as of December 31, 1986, and the end-of-day value uses a base value of 100.00 as of December 19, 1978.
S&P 500 Index: The S&P 500 Index is widely regarded as the best single gauge of large-cap U.S. equities and serves as the foundation for a wide range of investment products. The index includes 500 leading companies and captures approximately 80% coverage of the available market capitalization.
MSCI Emerging Markets Index: The MSCI Emerging Markets Index is a free-float-adjusted equity index that captures large- and mid-cap representation across emerging-market countries. The index covers approximately 85% of the free-float-adjusted market capitalization in each country.
U.S. Aggregate: The Bloomberg U.S. Aggregate Bond Index is a broad-based benchmark that measures the investment-grade, U.S. dollar-denominated, fixed-rate taxable bond market. The index includes Treasuries, government-related and corporate securities, agency fixed-rate pass-through mortgage-backed securities, asset-backed securities and commercial mortgage-backed securities.
MSCI ACWI ex USA Index: The MSCI ACWI ex USA Index is a free-float-adjusted equity index that measures large- and mid-cap representation across developed and emerging markets outside the United States. It was developed with a base value of 100 as of December 31, 1987.
About the Author