
Market Commentary - July 2026

Markets spent the first half of the year climbing a wall of worry. Despite higher oil prices, policy uncertainty, and nonstop predictions of what could go wrong, earnings grew, economic activity remained solid, and equities pushed higher. More importantly, market leadership broadened well beyond the stocks dominating financial headlines. The result was strong returns across much of the investment landscape.
| Index | July 2026 (%) | YTD (%) | 1-Year (%) | 3-Year Annualized (%) |
| S&P 500 Index | (1.0) | 10.2 | 22.3 | 20.6 |
| Dow Jones Industrial Average | 2.7 | 9.8 | 20.7 | 17.1 |
| NASDAQ Composite Index | (2.8) | 13.1 | 29.5 | 24.8 |
| Russell 2000 Index | 3.7 | 22.7 | 40.9 | 18.6 |
| MSCI All Country World Index (ex U.S.) | (0.6) | 14.0 | 28.4 | 19.5 |
| MSCI Emerging Markets Index | (1.4) | 24.0 | 44.2 | 23.6 |
| U.S. Aggregate Bond Index | 0.2 | 0.6 | 3.8 | 4.2 |
First Half Review: A Market Broader Than the Headlines
The first half of 2026 rewarded investors who looked beyond the daily headlines. While much of the attention centered on artificial intelligence, semiconductor shortages, and a handful of high-profile technology stocks, the market's advance was supported by a much broader set of forces. Strong corporate earnings, resilient economic growth, improving business investment, and expanding market participation collectively powered equities higher despite periods of geopolitical tension, higher energy prices, and ongoing uncertainty surrounding interest rates. The S&P 500 Index gained 10.2% during the first six months of the year, but beneath the surface, small- and mid-cap stocks outperformed large caps, the equal-weight S&P 500 Index outpaced its capitalization-weighted counterpart, and a majority of sectors generated positive returns. In many respects, the story of the first half was not simply one of artificial intelligence, but of an economy that continued to demonstrate surprising resilience.
That resilience was tested in March as the Iran conflict pushed oil prices 50% higher and reignited inflation concerns. Yet markets recovered quickly as investors refocused on fundamentals. Earnings estimates moved meaningfully higher throughout the period, an unusual development this late in an economic cycle. Analysts now expect S&P 500 companies to produce more than 23% earnings growth this year, supported by continued capital investment, productivity improvements, and strong demand across many areas of the economy. At the same time, economic growth remained steady and labor market conditions continued to support consumer spending, reinforcing confidence that the expansion remains intact despite higher interest rates and lingering affordability challenges.
June, however, provided an important reminder that markets rarely move in a straight line. Leadership broadened as investors rotated away from some of the year's biggest winners and into sectors more closely tied to the underlying economy. Industrials, Health Care, Financials, and Utilities outperformed during the month, while Communication Services, Energy, Consumer Discretionary, and Technology lagged. Rather than signaling a deterioration in fundamentals, the rotation suggested that investors were becoming increasingly focused on the durability of economic growth rather than a narrow set of market themes. That distinction matters because it points directly to one of the most important questions facing investors today: what will drive the next stage of economic growth? Increasingly, the answer appears to be productivity. And that brings us to an important shift now underway at the Federal Reserve.
A New Era at the Federal Reserve
June marked Kevin Warsh's first Federal Reserve meeting as Chairman, and while no major policy changes emerged from the meeting itself, investors received important clues about how monetary policy may evolve in the years ahead. Warsh has signaled a preference for a more data-dependent and less scripted Federal Reserve, drawing philosophical parallels to former Chairman Alan Greenspan's approach to monetary policy. Rather than relying heavily on forward guidance and detailed policy forecasts, Warsh appears to favor allowing markets to respond directly to economic developments as they occur.
Perhaps more important than his communication style is his emphasis on productivity. Throughout his early remarks, Warsh has highlighted the role of technological advancement, capital investment, and efficiency gains in driving sustainable economic growth. He has also challenged the notion that strong growth and low unemployment must inevitably lead to higher inflation, suggesting that productivity improvements can help support both economic expansion and price stability simultaneously.
For investors, this shift matters because it suggests a Federal Reserve that may be more willing to allow economic growth to continue so long as inflation remains contained. While markets may experience periods of increased volatility as investors adjust to a less predictable Fed, the underlying message is constructive: productivity, not simply monetary stimulus, may become an increasingly important driver of future economic growth.
Earnings Continue to Drive Markets Higher
While Federal Reserve policy often dominates headlines, corporate earnings ultimately remain the foundation of long-term equity returns. Here the news continues to be remarkably strong. According to FactSet, analysts currently expect S&P 500 companies to deliver second-quarter earnings growth of 23.1% compared to a year ago. If realized, this would represent the second consecutive quarter of earnings growth above 20% and the seventh straight quarter of double-digit earnings expansion. Particularly noteworthy is that analysts have increased earnings estimates during the quarter, a rare occurrence given that estimates typically decline as reporting periods progress.
The strength is also broadening. Ten of the 11 S&P 500 sectors are projected to report year-over-year earnings growth, led by Energy, Information Technology, and Materials. Corporate management teams have generally maintained an optimistic tone as well, with more companies issuing positive earnings guidance than negative guidance heading into reporting season.
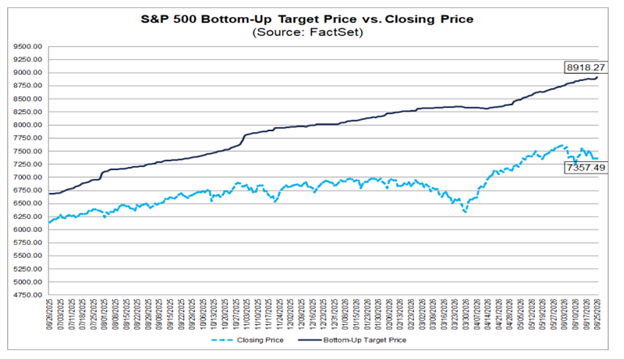
Looking beyond the current quarter, Wall Street’s outlook remains constructive. Analysts project full-year S&P 500 earnings growth of 24.0% in 2026 followed by another 16.8% increase in 2027. At the same time, aggregate analyst price targets imply approximately 21% upside for the S&P 500 over the next twelve months. While analyst targets should always be viewed with appropriate caution, they reflect growing confidence that earnings growth can continue even as economic growth moderates.
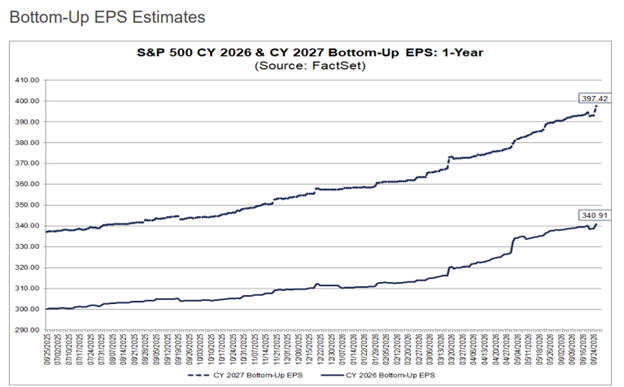
Valuations are not cheap. The S&P 500 currently trades at roughly 20.1 times forward earnings, modestly above both its five-year and ten-year averages. However, unlike previous periods when valuation expansion alone drove market gains, much of today's appreciation has been supported by rising earnings expectations.

Housing Finds Its Footing
If earnings represent one of the economy's strongest areas, housing has been one of its most persistent challenges. The combination of rapidly rising home prices during the pandemic, sharply higher mortgage rates following the Federal Reserve's tightening cycle, and widespread shortages of new housing units created one of the most difficult affordability environments in decades.
However, there are increasing signs that the housing market is gradually moving toward a healthier balance.
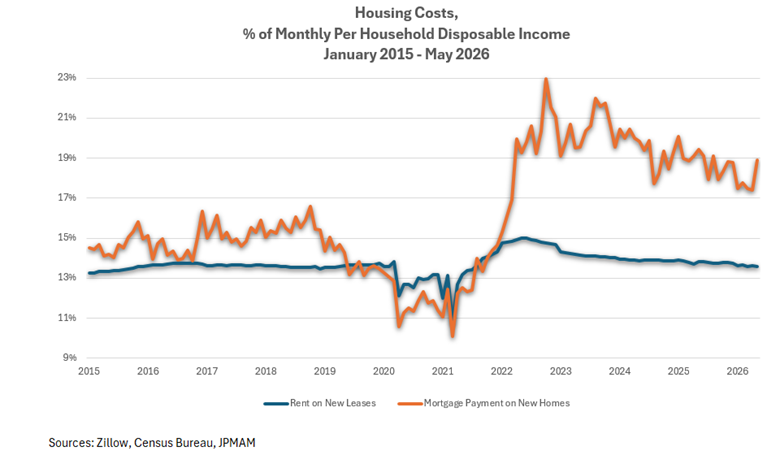
Unlike financial markets, housing markets tend to adjust slowly. Homeowners are often reluctant to lower asking prices, particularly when many remain locked into mortgages originated at historically low interest rates. Nevertheless, affordability has begun improving through a combination of stabilizing home prices, rising household incomes, moderating rent growth, and increased housing supply.
New home prices have largely leveled off over the past several years, while income growth has continued. In addition, a significant amount of new housing inventory has entered the market. At the same time, rental vacancy rates have risen and rent growth has slowed considerably from the pace experienced during and immediately after the pandemic.
These developments have important economic implications. Shelter costs represent roughly one-third of the Consumer Price Index and tend to influence inflation with a lag. As rents continue to normalize, housing may become an increasingly important source of disinflation during the coming year. A healthier housing market could also reduce upward pressure on interest rates and support a more stable economic expansion.
Housing also helps illustrate why today's economy can feel so different depending on where one stands. For existing homeowners, rising incomes, accumulated home equity, and locked-in low mortgage rates have helped preserve financial flexibility. For first-time buyers and renters, however, affordability remains a meaningful constraint even as conditions gradually improve. In that sense, housing is not just a source of inflation pressure or disinflation relief. It is also one of the clearest examples of the split-screen economy now shaping consumer confidence and market sentiment.
The Split-Screen Economy
Housing offers a clear window into a broader reality: this expansion looks very different depending on income, age, and asset ownership. Corporate profits, stock prices, and inflation trends point to resilience, while household sentiment remains more cautious after several years of higher prices and elevated borrowing costs.
That divide is often described as a “K-shaped economy,” where different groups experience the same expansion in very different ways.
For households that own financial assets, strong market returns, rising home equity, and a resilient labor market have supported healthy balance sheets and continued spending. Demand for travel, higher-end services, and other discretionary categories has remained surprisingly firm, reflecting the strength of these consumers.
For households with fewer financial assets, the experience has been more challenging. Inflation has moderated, but prices remain considerably higher than they were just a few years ago. These consumers have benefited less directly from the appreciation in stock prices and continue to feel the impact of higher costs for essentials.
Importantly, both realities can exist at the same time. Strong earnings growth, healthy corporate profits, and resilient markets do not necessarily mean every household is prospering equally. Conversely, affordability pressures and cautious sentiment do not necessarily signal recession.
This divergence helps explain why consumer sentiment often appears weaker than traditional economic indicators would suggest. Growth can remain positive, markets can move higher, and individual experiences can still vary meaningfully across income levels, generations, and asset ownership.
Looking Ahead
As we enter the second half of the year, several themes appear increasingly interconnected. A new Federal Reserve leadership team is emphasizing productivity and economic growth rather than relying heavily on policy guidance. Corporate earnings remain the primary driver of market performance and continue to exceed expectations. Housing affordability is slowly improving, creating a potential tailwind for both inflation and economic stability. Yet the benefits of these developments are not being shared evenly across the economy.
For investors, the lesson may be that both optimism and caution are warranted. The fundamental backdrop supporting financial markets remains constructive, supported by earnings growth, improving productivity, and a gradually healing housing market. At the same time, affordability concerns and economic divergence remind us that broad economic statistics do not always capture the experience of every household.
As always, history teaches that economic transitions rarely follow a straight path. However, the combination of strong corporate fundamentals, moderating inflation pressures, and improving productivity suggests that the economy may be adjusting in a healthier manner than many anticipated a year ago. That remains a constructive backdrop for long-term investors, even if the journey continues to be uneven along the way.
Thank you for your continued confidence in our team, and please reach out with any questions you may have. It is our pleasure to share life’s journey with you.
Market Commentary Disclosures
*Magnificent Seven: The term "Magnificent Seven" was coined by others and should not be construed as an endorsement or indicator of any stock or company's quality.
This document is a general communication being provided for informational purposes only. It is educational in nature and not designed to be taken as advice or a recommendation for any specific investment product, strategy, plan feature or other purpose in any jurisdiction, nor is it a commitment from Towne Trust to participate in any of the transactions mentioned herein. Any examples used are generic, hypothetical and for illustration purposes only. This material does not contain sufficient information to support an investment decision and it should not be relied upon by you in evaluating the merits of investing in any securities or products. In addition, users should make an independent assessment of the legal, regulatory, tax, credit, and accounting implications and determine, together with their own financial professional, if any investment mentioned herein is believed to be appropriate to their personal goals. Investors should ensure that they obtain all available relevant information before making any investment. Any forecasts, figures, opinions or investment techniques and strategies set out are for information purposes only, based on certain assumptions and current market conditions as of the date given and are subject to change without prior notice. All information presented herein is considered to be accurate at the time of production, but no warranty of accuracy is given and no liability in respect of any error or omission is accepted. It should be noted that investment involves risks, the value of investments and the income from them may fluctuate in accordance with market conditions and taxation agreements and investors may not get back the full amount invested. Neither past performance or yields are reliable indicators of current and future results.
Stock investments involve risk, including loss of principal. High-quality stocks may be appropriate for some investment strategies. Ensure that your investment objectives, time horizon and risk tolerance are aligned with investing in stocks, as they can lose value. Although we define “high quality” stocks as having high and stable profitability (return on equity, earnings variability) the term “high quality” is not a recommendation for any specific investment as stocks may not be appropriate for some investment strategies.
There are risks associated with fixed-income investments, including credit risk, interest rate risk, and prepayment and extension risk. In general, bond prices rise when interest rates fall and vice versa. This effect is usually more pronounced for longer term securities. A rise in interest rates may result in a price decline of fixed-income instruments held by the fund, negatively impacting its performance and NAV. Falling rates may result in the fund investing in lower yielding debt instruments, lowering the fund’s income and yield. These risks may be heightened for longer maturity and duration securities.
Towne Trust, its affiliates and/or their respective officers, directors or employees may from time to time acquire, hold or sell securities mentioned herein.
Not FDIC Insured • May Lose Value • Not Bank Guaranteed • Not a Deposit
Index Definitions
Dow Jones Industrial Average: The Dow Jones Industrial Average is a price-weighted average of the 30 blue chip stocks that are generally the leaders in their industry. It has been widely followed indicator of the stock market since October 1, 1928.
NASDAQ Composite Index: The NASDAQ Composite Index is a broad-based capitalization-weighted index of stocks in all three NASDAQ tiers: Global Select, Global Market and Capital Market. The index was developed with a base level of 100 as of February 5, 1971.
Russell 2000 Index: The Russell 100 Index is comprised of the smallest 2,000 companies in the Russell 1000 Index, representing approximately 8% of the Russell 3000 total market capitalization. The real-time value is calculated with a base value of 135.00 as of December 31, 1986. The end-of-day value is calculated with a base value of 100.00 as of December 19,1978.
S&P 500 Index: The S&P 500 Index is widely regarded as the best single gauge of large-cap U.S. equities and serves as the foundation for a wide range of investment products. The index includes 500 leading companies and captures approximately 80% coverage of the available market capitalization.
MSCI Emerging Markets Index: The MSCI EM (Emerging Markets) Index is a free-float weighted equity index that captures large and mid-cap representation across Emerging Markets (EM) countries. The index covers approximately 85% of the free float-adjusted market capitalization in the each country.
U.S. Aggregate: The Bloomberg USAgg Index is a broad-based flagship benchmark that measures the investment grade, US dollar-denominated, fixed-rate taxable bond market. The index includes Treasuries, government-related and corporate securities, MBS (Agency fixed-rate pass-through), ABS and CMBS (agency and non-agency). (Future Ticker: I00001US)
MSCI ACWI Excluding United States Index: The MSCI AC World ex USA Index is a free-float weighted equity index. It was developed with a base value of 100 as of December 31, 1987.