
Market Commentary - August 2026

July was a month of validation. Investors entered earnings season looking for proof that heavy spending on artificial intelligence, technology infrastructure, and business investment was translating into real economic value. Rising oil prices, escalating tensions in the Middle East, and an increasingly divided Federal Reserve reminded markets that risks remain. Yet beneath the headlines, the broader story remained largely unchanged: earnings growth was strong, economic activity remained resilient, and the economy continued to absorb challenges without showing meaningful signs of deterioration.
| Index | July 2026 (%) | YTD (%) | 1-Year (%) | 3-Year Annualized (%) |
| S&P 500 Index | (0.1) | 10.1 | 19.5 | 19.3 |
| Dow Jones Industrial Average | 0.4 | 10.2 | 20.9 | 15.9 |
| NASDAQ Composite Index | (3.2) | 9.5 | 20.9 | 21.8 |
| Russell 2000 Index | (3.0) | 19.0 | 34.3 | 15.1 |
| MSCI All Country World Index (ex U.S.) | 0.4 | 14.5 | 29.2 | 18.1 |
| MSCI Emerging Markets Index | (3.0) | 20.3 | 37.1 | 19.3 |
| U.S. Aggregate Bond Index | (1.3) | (0.7) | 2.7 | 3.7 |
July Review: Markets Become More Selective
If the first half of the year was characterized by expanding market participation and growing confidence in the economic outlook, July marked a period of greater selectivity. Investors entered the month with elevated expectations following a strong first half, and market leadership continued to broaden as capital moved beyond a narrow group of companies and sectors. While the major U.S. equity indices delivered mixed results, leadership rotated toward areas more closely tied to the underlying economy. Energy led all sectors with a gain of 12.5%, followed by Financials (+6.0%), Real Estate (+2.5%), and Health Care (+2.2%). In contrast, Information Technology (-8.0%), Industrials (-3.1%), Utilities (-2.3%), and Materials (-1.7%) lagged as investors reassessed valuations and long-term growth expectations. The equal-weight S&P 500 Index outperformed its capitalization-weighted counterpart, reinforcing the view that the market's advance has become increasingly broad-based rather than dependent on a handful of large technology companies.
Fixed income markets reflected a similarly balanced backdrop. Treasury yields moved higher across the curve during the month as investors weighed resilient economic growth, evolving inflation expectations, and uncertainty surrounding the future path of monetary policy. Despite higher rates and ongoing geopolitical tensions, the fundamental backdrop remained constructive. Corporate America continued to demonstrate resilience, economic activity showed few signs of meaningful weakness, and investors increasingly focused on fundamentals rather than narratives alone. Taken together, July did not materially alter the investment landscape. Instead, it reinforced a theme that has been building throughout much of the year: market leadership is broadening, fundamentals remain supportive, and investors are becoming more discerning about where future growth and value are likely to emerge.
Q2 Earnings Season: Strong Results, Higher Expectations
Second-quarter earnings season has largely reinforced the economic resilience we discussed earlier, but it has also highlighted a subtle shift occurring beneath the surface of the market. With 61% of S&P 500 Index companies having reported results, 86% exceeded earnings expectations and 77% surpassed revenue forecasts. The blended earnings growth rate has climbed to 47.4%, the strongest since 2021, while revenue growth is tracking at 14.1%. Even after adjusting for several unusually large investment-related gains reported by a handful of companies, earnings growth remains impressive and well above historical averages. Perhaps most notable, analysts continued raising earnings estimates during July, a departure from the typical seasonal pattern that often sees estimates move lower as earnings season unfolds.
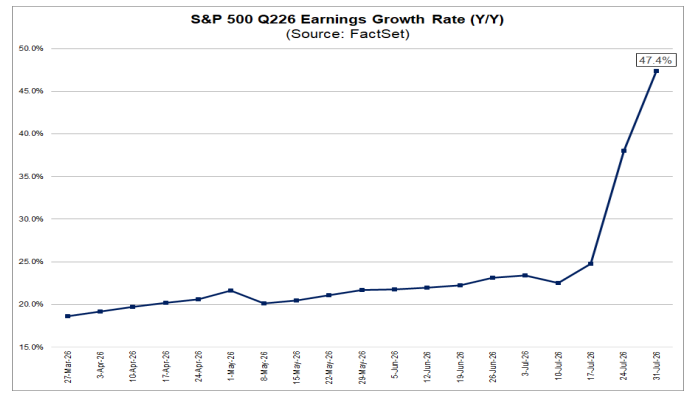
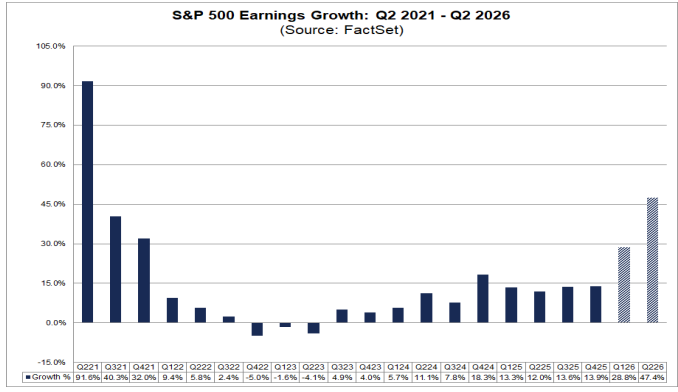
Yet despite these strong results, investors spent much of July questioning whether the extraordinary level of spending associated with artificial intelligence will ultimately generate returns commensurate with the capital being deployed. Nowhere was that debate more visible than in semiconductors. The Philadelphia Stock Exchange Semiconductor Index (SOX) declined roughly 21% during the month, reflecting investor concerns over AI monetization, hyperscaler capital expenditures, memory supply growth, and the timing of future returns.
Ironically, the semiconductor selloff occurred even as many of the industry's largest customers delivered strong results. Microsoft reported another quarter of robust cloud and AI-driven growth, with earnings of $4.74 per share exceeding estimates and contributing meaningfully to the Information Technology sector's earnings growth. Amazon posted headline earnings well above expectations and delivered continued strength in both e-commerce and AWS, while reaffirming substantial investment plans tied to artificial intelligence. Alphabet reported strong operating results alongside sizable investment gains that meaningfully boosted reported earnings, and management continued to emphasize growing demand across its cloud and AI businesses. Collectively, these results suggest the demand side of the AI investment cycle remains healthy, even as investors become more focused on the ultimate economic returns generated by that spending.
The market's reaction to these reports revealed an important distinction between good fundamentals and investor expectations. Companies that demonstrated measurable AI adoption, accelerating cloud demand, or improving monetization were generally rewarded, while businesses perceived as falling short of increasingly ambitious expectations faced far harsher scrutiny. Meta Platforms offered perhaps the best example. Despite continued growth in engagement, advertising demand, and AI-related investments, investors reacted cautiously to the company's outlook and spending trajectory.
More broadly, July reminded investors that as technologies mature, narratives alone are no longer sufficient. Markets are transitioning from a phase where investment announcements drive valuations to one where evidence of productivity gains, revenue growth, and earnings generation carries greater weight. That shift helps explain why one of the strongest earnings seasons in years coincided with one of the sharpest monthly declines in semiconductor shares. Investors have not abandoned the AI story. They have simply begun demanding proof.
Black Monday, Meet Blue Tuesday
One company found itself squarely at the center of July's changing market narrative. On July 14, IBM, long known by investors as "Big Blue", pre-announced second-quarter results that disappointed investors and triggered a stunning 25% one-day decline, the worst single-day performance in the company's history. The selloff was particularly striking given IBM's status as one of corporate America's most recognizable technology companies and came during an earnings season that was otherwise characterized by strong results across much of the market. The sheer magnitude of the decline was enough to evoke memories of another infamous market event.
If you were actively investing in 1987, Black Monday is likely one of those rare moments where you remember exactly where you were when the headlines crossed the tape. On October 19, 1987, the Dow Jones Industrial Average plunged 22.6% in a single day while the S&P 500 Index fell more than 20%, still the largest one-day percentage decline in the history of both indices. The crash erased an estimated $1.7 trillion in global market value and fueled fears that a financial crisis or deep recession could be unfolding. Concerns over elevated valuations, rising interest rates, trade imbalances, and computerized trading strategies all contributed to the panic. Yet despite the severity of the selloff, the economy ultimately proved resilient and financial markets recovered. While IBM's "Blue Tuesday" carried none of the systemic implications of Black Monday, the comparison serves as a useful reminder that dramatic market declines often reveal as much about investor expectations as they do about underlying fundamentals.
The New Oil Chokepoint
While much of the market's attention remained focused on earnings and artificial intelligence, events in the Middle East quietly reshaped the global energy landscape during July. Since the outbreak of the U.S.-Iran conflict earlier this year, Saudi Arabia has increasingly relied on its East-West Pipeline, often referred to as Petroline, to transport crude from its eastern oil fields to the Red Sea export terminal at Yanbu, bypassing the Strait of Hormuz. The strategy has been remarkably important for global energy markets. Saudi exports through Red Sea ports have averaged roughly 4.7 million barrels per day since March, nearly triple year-ago levels, and the pipeline itself has the capacity to move approximately 7 million barrels per day across the kingdom. However, what initially appeared to be a solution to one geopolitical risk has merely shifted vulnerability elsewhere. Any tanker leaving Yanbu for Asian markets must still transit the Bab el-Mandeb Strait at the southern end of the Red Sea, a waterway that has increasingly come under threat from Iran-backed Houthi forces operating in Yemen.

That vulnerability became increasingly apparent during July. The Houthis announced a maritime blockade of Saudi-linked shipping, threatened traffic through the Red Sea, and launched attacks against Saudi energy infrastructure and tankers. Several vessels altered course, shipping activity through key waterways slowed, and insurance costs climbed as market participants reassessed the risks associated with moving crude through the region. The significance of these developments extends beyond shipping logistics. For much of the year, investors viewed the Strait of Hormuz as the primary geopolitical risk to global energy supplies. By late July, markets were forced to contemplate the possibility that two critical energy chokepoints, Hormuz and Bab el-Mandeb, could face simultaneous disruption. The result was a meaningful increase in the geopolitical risk premium embedded in oil prices.
Energy markets responded accordingly. After beginning July near $70 per barrel, West Texas Intermediate crude climbed 21% during the month to finish near $85, while Brent crude rose 24% to approximately $90 per barrel, posting the strongest monthly gain since March. The rally reflected more than just concerns over current supply disruptions. Investors increasingly recognized that the Iran conflict had evolved from a localized military confrontation into a broader challenge to global energy transportation networks. Yet despite the sharp move higher in oil prices and the accompanying increase in geopolitical uncertainty, financial markets largely avoided the broad risk-off reaction many feared earlier in the year. Much like the events of March and April, July served as another reminder that while geopolitical developments can meaningfully influence energy markets and inflation expectations, corporate earnings and economic fundamentals continue to play an equally important role in determining the direction of financial markets.
The Fed Waits, The Bond Market Votes
If rising oil prices put upward pressure on inflation expectations, the July Federal Reserve meeting highlighted just how uncertain the policy outlook has become. As expected, the Federal Open Market Committee left the federal funds rate unchanged at 3.50%-3.75%. What captured investors' attention, however, was not the decision itself but the lack of forward guidance accompanying it. Chair Kevin Warsh declined to provide a clear roadmap for future rate decisions, while three members of the Committee dissented in favor of an immediate rate increase, an unusually public display of disagreement within the Fed. Treasury yields moved higher following the meeting as investors interpreted the Fed's message as one of caution rather than confidence. With inflation remaining above target and oil prices surging throughout July, policymakers appeared unwilling to signal that the tightening cycle had definitively ended.
The most important dissent at the July meeting may not have come from the three voting members who favored a rate increase. It may have come from the bond market itself. Historically, the 2-year Treasury yield has been one of the market's best gauges of future Federal Reserve policy because it incorporates investors' collective expectations for growth, inflation, and short-term interest rates. At month-end, the 2-year Treasury yielded approximately 4.4%, nearly 75 basis points above the current federal funds rate. That gap suggests fixed-income investors remain unconvinced that policy is sufficiently restrictive and continue to assign meaningful odds to additional tightening or, at the very least, a prolonged period of elevated rates. While bond investors do not always get the timing right, their track record of correctly identifying the direction of policy shifts has been remarkably strong. In effect, the message from the Treasury market appears clear: inflation risks have moderated, but they have not yet been defeated.
For investors, the remainder of 2026 is shaping up to be less about whether the Fed cuts rates and more about whether it needs to raise them again. Economic growth is slowing but remains positive, labor markets remain unusually tight, corporate earnings continue to exceed expectations, and geopolitical developments have pushed energy prices sharply higher. Against that backdrop, Fed officials appear content to keep their options open while allowing additional data to guide future decisions. The newly established Fed task forces examining labor market dynamics, productivity trends, and the inflationary implications of artificial intelligence are also likely to influence the policy debate in coming months, particularly as policymakers attempt to distinguish temporary price pressures from longer-term structural changes in the economy. For now, both the Fed and the bond market appear to agree on one thing: uncertainty remains elevated, and investors should not expect monetary policy to fade from the spotlight anytime soon.
Looking Ahead
For all the market's focus on earnings, geopolitics, and monetary policy, perhaps the most important takeaway from July was that the economy continued to absorb each challenge without showing meaningful signs of deterioration. Corporate earnings broadly exceeded expectations, consumers continued to spend, labor markets remained resilient, and economic growth, while slower, remained positive. Markets were forced to navigate a semiconductor correction, a sharp rise in oil prices, renewed geopolitical tensions, and a Federal Reserve that offered little clarity on its next move. Yet through it all, the underlying foundation of the economy held together remarkably well. That does not mean risks have disappeared, but it does suggest that the expansion remains more durable than many anticipated at the start of the year.
As we move into the second half of 2026, investors should expect markets to remain sensitive to developments in Washington, the path of inflation, and the evolution of events in the Middle East. History also suggests that volatility often increases as midterm election campaigns begin to take shape and investors attempt to handicap potential policy outcomes. Political headlines will undoubtedly compete for attention in the months ahead, but experience has shown that long-term investment returns are driven far more by earnings growth, innovation, productivity, and economic fundamentals than by election cycles. While the path forward is unlikely to be perfectly smooth, our long-term investment outlook remains intact. We continue to believe that patient investors will be rewarded by the combination of improving productivity, ongoing corporate investment, and an economy that has consistently demonstrated an ability to adapt to changing conditions. Periods of uncertainty may create bouts of volatility, but they also create opportunities for disciplined investors willing to keep their focus on the long term.
Thank you for your continued confidence in our team, and please reach out with any questions you may have. It is our pleasure to share life’s journey with you.
Market Commentary Disclosures
*Magnificent Seven: The term "Magnificent Seven" was coined by others and should not be construed as an endorsement or indicator of any stock or company's quality.
This document is a general communication being provided for informational purposes only. It is educational in nature and not designed to be taken as advice or a recommendation for any specific investment product, strategy, plan feature or other purpose in any jurisdiction, nor is it a commitment from Towne Trust to participate in any of the transactions mentioned herein. Any examples used are generic, hypothetical and for illustration purposes only. This material does not contain sufficient information to support an investment decision and it should not be relied upon by you in evaluating the merits of investing in any securities or products. In addition, users should make an independent assessment of the legal, regulatory, tax, credit, and accounting implications and determine, together with their own financial professional, if any investment mentioned herein is believed to be appropriate to their personal goals. Investors should ensure that they obtain all available relevant information before making any investment. Any forecasts, figures, opinions or investment techniques and strategies set out are for information purposes only, based on certain assumptions and current market conditions as of the date given and are subject to change without prior notice. All information presented herein is considered to be accurate at the time of production, but no warranty of accuracy is given and no liability in respect of any error or omission is accepted. It should be noted that investment involves risks, the value of investments and the income from them may fluctuate in accordance with market conditions and taxation agreements and investors may not get back the full amount invested. Neither past performance or yields are reliable indicators of current and future results.
Stock investments involve risk, including loss of principal. High-quality stocks may be appropriate for some investment strategies. Ensure that your investment objectives, time horizon and risk tolerance are aligned with investing in stocks, as they can lose value. Although we define “high quality” stocks as having high and stable profitability (return on equity, earnings variability) the term “high quality” is not a recommendation for any specific investment as stocks may not be appropriate for some investment strategies.
There are risks associated with fixed-income investments, including credit risk, interest rate risk, and prepayment and extension risk. In general, bond prices rise when interest rates fall and vice versa. This effect is usually more pronounced for longer term securities. A rise in interest rates may result in a price decline of fixed-income instruments held by the fund, negatively impacting its performance and NAV. Falling rates may result in the fund investing in lower yielding debt instruments, lowering the fund’s income and yield. These risks may be heightened for longer maturity and duration securities.
Towne Trust, its affiliates and/or their respective officers, directors or employees may from time to time acquire, hold or sell securities mentioned herein.
Index Definitions
Dow Jones Industrial Average: The Dow Jones Industrial Average is a price-weighted average of the 30 blue chip stocks that are generally the leaders in their industry. It has been widely followed indicator of the stock market since October 1, 1928.
NASDAQ Composite Index: The NASDAQ Composite Index is a broad-based capitalization-weighted index of stocks in all three NASDAQ tiers: Global Select, Global Market and Capital Market. The index was developed with a base level of 100 as of February 5, 1971.
Russell 2000 Index: The Russell 100 Index is comprised of the smallest 2,000 companies in the Russell 1000 Index, representing approximately 8% of the Russell 3000 total market capitalization. The real-time value is calculated with a base value of 135.00 as of December 31, 1986. The end-of-day value is calculated with a base value of 100.00 as of December 19,1978.
S&P 500 Index: The S&P 500 Index is widely regarded as the best single gauge of large-cap U.S. equities and serves as the foundation for a wide range of investment products. The index includes 500 leading companies and captures approximately 80% coverage of the available market capitalization.
MSCI Emerging Markets Index: The MSCI EM (Emerging Markets) Index is a free-float weighted equity index that captures large and mid-cap representation across Emerging Markets (EM) countries. The index covers approximately 85% of the free float-adjusted market capitalization in the each country.
U.S. Aggregate: The Bloomberg USAgg Index is a broad-based flagship benchmark that measures the investment grade, US dollar-denominated, fixed-rate taxable bond market. The index includes Treasuries, government-related and corporate securities, MBS (Agency fixed-rate pass-through), ABS and CMBS (agency and non-agency). (Future Ticker: I00001US)
MSCI ACWI Excluding United States Index: The MSCI AC World ex USA Index is a free-float weighted equity index. It was developed with a base value of 100 as of December 31, 1987.