Market Commentary - June 2026


Equity markets extended their advance through May, with major indices reaching new highs and completing one of the strongest multi-month rallies in recent decades. The move was driven by continued strength in a narrow group of technology- and growth-oriented companies, alongside resilient economic data and steady earnings trends. At the same time, the backdrop has become increasingly complex. Market leadership has narrowed, the equity risk premium has compressed meaningfully, and expectations for monetary policy have become less certain, with investors weighing the possibility of both easing and renewed tightening later in the year. What follows highlights how markets have navigated these competing forces, rewarding momentum and earnings strength while leaving a narrower margin for error beneath the surface.
| Index | May 2026 (%) | YTD (%) | 1-Year (%) | 3-Year Annualized (%) |
| S&P 500 Index | 5.3 | 11.3 | 29.7 | 23.6 |
| Dow Jones Industrial Average | 2.9 | 6.9 | 22.7 | 17.9 |
| NASDAQ Composite Index | 8.4 | 16.3 | 42.0 | 28.7 |
| Russell 2000 Index | 4.4 | 18.3 | 43.2 | 20.3 |
| MSCI All Country World Index (ex U.S.) | 5.1 | 14.7 | 33.5 | 21.5 |
| MSCI Emerging Markets Index | 9.7 | 25.7 | 55.2 | 25.8 |
| U.S. Aggregate Bond Index | 0.3 | 0.4 | 5.1 | 4.0 |
Sector Spotlight: Headline Strength, Narrow Participation
- Technology has been the clear driver, with the Technology sector rising 19.8% in May and 32.8% year-to-date, creating a wide gap versus the rest of the market
- Participation has been uneven, with only a few sectors posting gains in May, including Health Care (2.4%, though still -3.0% year-to-date) and Consumer Discretionary (2.1%, 1.4% year-to-date)
- A majority of sectors declined during the month, including Industrials (-0.8%, 11.9% year-to-date), Financials (-1.1%, -5.3% year-to-date), and Communication Services (-0.7%, -1.4% year-to-date)
- Defensive areas remained under pressure in May, with Utilities (-5.2%, 4.8% year-to-date) and Energy (-5.6%, though still 26.7% year-to-date) showing meaningful short-term weakness
Nine Weeks and Counting: May’s Unstoppable, Top-Heavy Rally
Equity markets closed out May on a strong note, with the major U.S. indices reaching record highs and extending what has already been a powerful stretch for investors.
The tone of the market has been unmistakably positive. The S&P 500 Index has now strung together an extended run of weekly gains, and the Nasdaq has posted one of its strongest two month periods in decades. Periods like this naturally build confidence, and they tend to reinforce the prevailing narrative that momentum remains firmly in place.
At the same time, the character of the rally is worth noting. While index-level results have been impressive, leadership has narrowed. A relatively small group of sectors and companies continues to drive a disproportionate share of returns, particularly within technology. It is increasingly common to see days where the broader market struggles even as headline indices finish higher. That divergence between index performance and underlying breadth is an important feature of the current environment.
We are also beginning to see signs of expanding risk appetite. Smaller capitalization stocks have participated more meaningfully in recent weeks and have outperformed large caps over certain periods, even in the face of higher interest rate expectations. That participation appears to be fueled by investor interest in growth-oriented themes, including artificial intelligence and other quantum computing, which are influencing both large and smaller companies.
Taken together, the market continues to reward exposure, but it is doing so in a way that is increasingly selective and momentum-driven. The strength at the index level contrasts with a more uneven experience beneath the surface, where leadership remains concentrated and outcomes are becoming more dependent on where investors are willing to pay for growth.
The Equity Risk Premium: A Shrinking Cushion
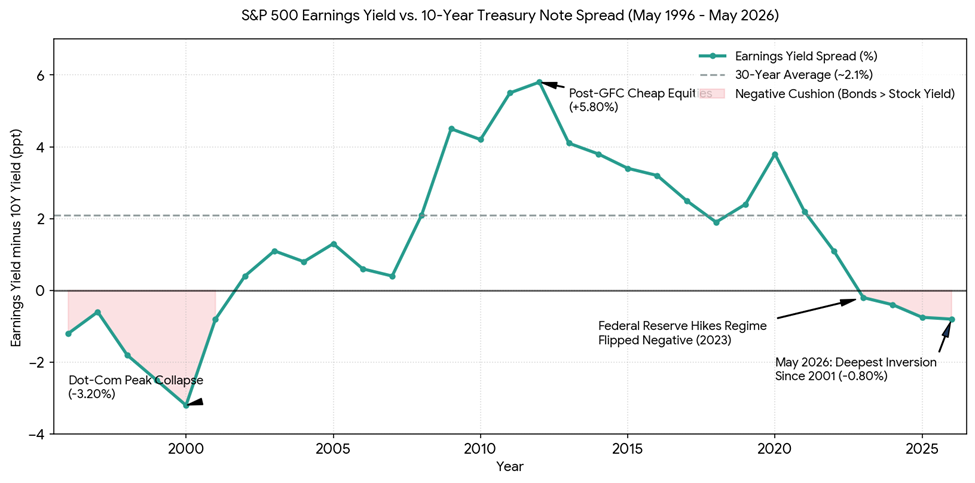
One way to frame the current environment is through the lens of the equity risk premium, as illustrated in the chart above. At its simplest, the equity risk premium represents the additional return investors expect to earn from equities over a “risk-free” asset such as U.S. Treasuries. In practice, it is often expressed using a straightforward market-based calculation, the earnings yield of the S&P 500 Index, or the inverse of the price-to-earnings ratio, minus the yield on the 10-year Treasury.
The chart highlights how that spread has evolved over time. When the gap is wide, investors are being compensated for the added volatility and uncertainty of equities. When it narrows, that compensation diminishes.
While the concept is foundational to modern asset pricing, its relevance is best understood in historical context. The chart captures periods where the equity risk premium has expanded and contracted meaningfully. Following the Global Financial Crisis, for example, the premium widened significantly as interest rates were held near zero. In that environment, investors were effectively pushed toward equities, and the earnings yield on stocks far exceeded the return available on government bonds. For much of that post-2008 period, the premium remained elevated, reinforcing the relative attractiveness of equities and supporting higher valuations.
Today, the relationship has shifted. As shown in the chart, the spread between equity earnings yields and Treasury rates has compressed to levels that are near the low end of the historical range and, at times, have turned negative. This reflects two forces working simultaneously. On one hand, investors continue to assign premium valuations to large-cap technology companies, driven by expectations that artificial intelligence and automation will translate into sustained earnings growth. On the other hand, rising Treasury yields, driven in part by persistent inflation and elevated fiscal deficits, have increased the return available in fixed income. The combination has brought the equity risk premium down to a level that offers relatively little cushion.
Rather than pointing to an immediate outcome, the chart simply frames the trade-off investors face today. When the equity risk premium is compressed, returns are less supported by valuation and more dependent on future growth and continued confidence. That dynamic has been evident in recent market behavior and helps explain why outcomes have become more selective, even as index-level performance remains strong.
The Yield Tug of War
The most recent Federal Reserve meeting reinforced a familiar message, but with a more nuanced undertone. Policy was left unchanged, and the baseline stance remains one of patience. At the same time, the discussion beneath the surface suggests less conviction around the next move. Inflation remains above target and has shown renewed firmness in recent months, influenced by higher energy prices and lingering supply pressures. The labor market, while no longer accelerating, continues to hold up, with steady job creation and unemployment near historically low levels. The result is an environment where the data has yet to provide a clear signal, leaving policy balanced between competing risks rather than pointed in a single direction.
That tension is increasingly reflected in market pricing. Fed funds futures indicate a high probability that the Fed remains on hold through the summer, but the expected path becomes less certain as the year progresses. As of late May, markets are beginning to assign a rising probability to the possibility of higher rates by year-end, rather than a clean easing cycle. Implied rate paths show only modest expectations for cuts and, in some cases, a gradual increase in the expected policy rate into late 2026. This shift highlights how sensitive expectations have become to incoming data, particularly around inflation, where further persistence could alter the policy trajectory.
What emerges is more of a push and pull between opposing forces, rather than a directional outlook. On one side, moderating growth and a gradually cooling labor market would typically support the case for easing. On the other, inflation that remains above target, combined with supply-side pressures and fiscal dynamics, argues for a more cautious or even restrictive stance. From a policy perspective, both outcomes remain plausible, and the Fed has shown little appetite to pre-commit to either path.
For investors, this reinforces an environment where policy is reactive rather than predictable. Equity markets can continue to perform, but they are increasingly reliant on earnings delivery and sustained confidence in forward growth assumptions. At the same time, fixed income offers a more compelling starting point than in prior years, though the path forward is unlikely to be smooth given the evolving rate backdrop. In that sense, the market is adjusting in real time to a shifting set of expectations, where neither cuts nor hikes are fully priced in, and the balance between them continues to move with each new data point.
Looking Ahead
Through the first five months of the year, equity markets have delivered strong index-level returns, supported by resilient economic growth, solid corporate earnings, and continued enthusiasm around technology and artificial intelligence. At the same time, the path higher has been increasingly narrow, with a small group of companies driving a disproportionate share of performance. While we remain constructive on equities given the underlying strength in the economy and earnings backdrop, we are equally mindful that valuations have expanded and the margin for error has narrowed, particularly in an environment where the equity risk premium is compressed and policy uncertainty remains elevated.
As we look to June and the remainder of the summer, several crosscurrents are likely to shape market behavior. From a seasonal perspective, the backdrop has been supportive, with the S&P 500 Index averaging positive returns in both June and July over the past decade and only one negative June or July during that period, which occurred in June 2022. That said, history tends to serve more as a compass than a Global Positioning System. Markets will continue to digest ongoing geopolitical developments, including the evolving situation in the Middle East and its impact on energy prices and inflation. At the same time, the cadence of economic data remains important, with inflation readings, labor market updates, and Fed communication continuing to influence expectations for the path of interest rates.
Taken together, we continue to see a supportive backdrop, but one that calls for a more disciplined approach. With valuations elevated and policy uncertainty still evolving, outcomes are likely to be more dependent on fundamentals than broad market momentum. In that type of environment, selectivity matters, and maintaining a consistent, long-term framework becomes increasingly important as the margin for error narrows.
Thank you for your continued confidence in our team, and please reach out with any questions you may have. It is our pleasure to share life’s journey with you.
Market Commentary Disclosures
*Magnificent Seven: The term "Magnificent Seven" was coined by others and should not be construed as an endorsement or indicator of any stock or company's quality.
This document is a general communication being provided for informational purposes only. It is educational in nature and not designed to be taken as advice or a recommendation for any specific investment product, strategy, plan feature or other purpose in any jurisdiction, nor is it a commitment from Towne Trust to participate in any of the transactions mentioned herein. Any examples used are generic, hypothetical and for illustration purposes only. This material does not contain sufficient information to support an investment decision and it should not be relied upon by you in evaluating the merits of investing in any securities or products. In addition, users should make an independent assessment of the legal, regulatory, tax, credit, and accounting implications and determine, together with their own financial professional, if any investment mentioned herein is believed to be appropriate to their personal goals. Investors should ensure that they obtain all available relevant information before making any investment. Any forecasts, figures, opinions or investment techniques and strategies set out are for information purposes only, based on certain assumptions and current market conditions as of the date given and are subject to change without prior notice. All information presented herein is considered to be accurate at the time of production, but no warranty of accuracy is given and no liability in respect of any error or omission is accepted. It should be noted that investment involves risks, the value of investments and the income from them may fluctuate in accordance with market conditions and taxation agreements and investors may not get back the full amount invested. Neither past performance or yields are reliable indicators of current and future results.
Stock investments involve risk, including loss of principal. High-quality stocks may be appropriate for some investment strategies. Ensure that your investment objectives, time horizon and risk tolerance are aligned with investing in stocks, as they can lose value. Although we define “high quality” stocks as having high and stable profitability (return on equity, earnings variability) the term “high quality” is not a recommendation for any specific investment as stocks may not be appropriate for some investment strategies.
There are risks associated with fixed-income investments, including credit risk, interest rate risk, and prepayment and extension risk. In general, bond prices rise when interest rates fall and vice versa. This effect is usually more pronounced for longer term securities. A rise in interest rates may result in a price decline of fixed-income instruments held by the fund, negatively impacting its performance and NAV. Falling rates may result in the fund investing in lower yielding debt instruments, lowering the fund’s income and yield. These risks may be heightened for longer maturity and duration securities.
Towne Trust, its affiliates and/or their respective officers, directors or employees may from time to time acquire, hold or sell securities mentioned herein.
Not FDIC Insured • May Lose Value • Not Bank Guaranteed • Not a Deposit
Index Definitions
Dow Jones Industrial Average: The Dow Jones Industrial Average is a price-weighted average of the 30 blue chip stocks that are generally the leaders in their industry. It has been widely followed indicator of the stock market since October 1, 1928.
NASDAQ Composite Index: The NASDAQ Composite Index is a broad-based capitalization-weighted index of stocks in all three NASDAQ tiers: Global Select, Global Market and Capital Market. The index was developed with a base level of 100 as of February 5, 1971.
Russell 2000 Index: The Russell 100 Index is comprised of the smallest 2,000 companies in the Russell 1000 Index, representing approximately 8% of the Russell 3000 total market capitalization. The real-time value is calculated with a base value of 135.00 as of December 31, 1986. The end-of-day value is calculated with a base value of 100.00 as of December 19,1978.
S&P 500 Index: The S&P 500 Index is widely regarded as the best single gauge of large-cap U.S. equities and serves as the foundation for a wide range of investment products. The index includes 500 leading companies and captures approximately 80% coverage of the available market capitalization.
MSCI Emerging Markets Index: The MSCI EM (Emerging Markets) Index is a free-float weighted equity index that captures large and mid-cap representation across Emerging Markets (EM) countries. The index covers approximately 85% of the free float-adjusted market capitalization in the each country.
U.S. Aggregate: The Bloomberg USAgg Index is a broad-based flagship benchmark that measures the investment grade, US dollar-denominated, fixed-rate taxable bond market. The index includes Treasuries, government-related and corporate securities, MBS (Agency fixed-rate pass-through), ABS and CMBS (agency and non-agency). (Future Ticker: I00001US)
MSCI ACWI Excluding United States Index: The MSCI AC World ex USA Index is a free-float weighted equity index. It was developed with a base value of 100 as of December 31, 1987.
About the Author