Market Commentary - April 2026


March delivered a broad risk off tone as surging oil prices forced a reset in expectations for growth, inflation, and earnings amid the ongoing conflict with Iran. The Federal Reserve held policy rates steady, as expected, while March labor market data surprised to the upside. Even so, first quarter growth forecasts have softened, even as the White House unveiled a historic increase in defense spending.
| Index | February 2026 (%) | YTD (%) | 1-Year (%) | 3-Year Annualized (%) |
| S&P 500 Index | (5.0) | (4.4) | 17.8 | 18.3 |
| Dow Jones Industrial Average | (5.2) | (3.2) | 12.2 | 13.8 |
| NASDAQ Composite Index | (4.7) | (7.0) | 25.6 | 21.8 |
| Russell 2000 Index | (5.2) | 0.9 | 25.8 | 13.0 |
| MSCI All Country World Index (ex U.S.) | (10.7) | (0.6) | 25.7 | 15.2 |
| MSCI Emerging Markets Index | (13.0) | (0.1) | 30.3 | 15.4 |
| U.S. Aggregate Bond Index | (1.8) | (0.1) | 4.4 | 3.6 |
March was a broad risk-off month with the major U.S. stock indices declining five percent as the escalating Middle East conflict and resulting higher energy prices weighed heavily on sentiment. International markets were hit harder, with the MSCI All-Country World Index ex-U.S. declining 11% and Emerging Markets declining 13%, reflecting the global growth and inflation sensitivity to an energy shock. The Energy sector surged 10% in March, while the other ten sectors declined between 3% and 9%. Yields across the Treasury curve (two to thirty years) rose between 25 and 30 basis points in March, erasing February’s declines.
Geopolitical Escalation Reprices Market Risk
As we discussed last month, geopolitical risk rose sharply in late February as conflict between the United States, Israel, and Iran escalated beyond bilateral lines and introduced renewed uncertainty into global energy markets. That escalation set the tone for March, as markets were forced to reassess inflation risk, monetary policy expectations, and the durability of elevated oil prices.
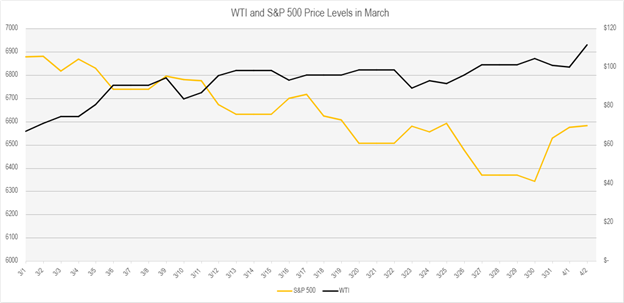
What followed over the course of March was not a steady deterioration, but a series of rapid repricings as markets attempted to incorporate evolving geopolitical developments into an already fragile macro backdrop. Early optimism that the conflict might remain contained gave way to repeated bouts of volatility as oil prices surged on renewed concerns about supply disruptions and shipping risks through the Strait of Hormuz. Each spike in crude prices had a familiar effect. Inflation expectations firmed, Treasury yields moved higher, and equities sold off as investors recalibrated how much policy flexibility the Federal Reserve might realistically have if energy driven inflation proved persistent. These moves reflected less a change in underlying economic fundamentals and more a tightening of financial conditions driven by uncertainty.
As the month progressed, market reactions became increasingly reflexive. Positive headlines around negotiations or diplomatic overtures were often met with brief rallies, only to reverse when subsequent developments raised doubts about the credibility or durability of any near term resolution. By mid to late March, investors appeared less focused on predicting outcomes and more focused on managing exposure to tail risk. Equity weakness broadened beneath the surface, leadership stocks came under pressure, and volatility clustered around days when oil prices and yields rose in tandem. This pattern underscored a key dynamic of the month. The market was not pricing a recession, but it was pricing a narrower margin for error.
That narrowing margin showed up most clearly in interest rate markets. As oil prices rose and near term inflation expectations moved higher, Treasury yields increased, particularly at the front end of the curve, where sensitivity to Federal Reserve policy is greatest. Interest rate futures responded by sharply reducing expectations for near term rate cuts, with markets shifting from anticipating multiple cuts later this year to treating any easing as conditional and uncertain. This repricing reflected concern that an energy driven inflation shock, even if temporary, could delay the Fed’s ability to ease policy without risking a loss of credibility.
The Fed’s Perspective
At its March 18 meeting, the Federal Reserve left policy rates unchanged, and Chair Jerome Powell was explicit about the challenge facing policymakers. While acknowledging that inflation has eased meaningfully from its post pandemic highs, Powell emphasized that inflation remains above the Fed’s two percent target and that recent increases in near term inflation expectations likely reflect higher oil prices tied to Middle East disruptions. He noted that while longer term inflation expectations remain well anchored, the implications of the conflict are uncertain, and the Fed must remain attentive to risks on both sides of its dual mandate. Importantly, Powell made clear that progress on inflation remains a prerequisite for further rate cuts. Absent that progress, policy easing would be delayed.
Powell also reinforced a key distinction that markets have been grappling with throughout March. Historically, the Fed has often looked through energy driven price shocks on the assumption that they are temporary and self correcting. However, Powell cautioned that this approach becomes more complicated when inflation has already been running above target for an extended period. While the Fed is inclined to wait and see how the current energy shock evolves, a series of shocks or a sustained rise in energy prices could eventually threaten inflation expectations and force a policy response. This tension between downside risks to the labor market and upside risks to inflation is now central to the Fed’s decision making framework.
Labor Market Update
On April 3, the Bureau of Labor Statistics reported March payrolls that surprised to the upside, with U.S. economy adding 178,000 jobs against a consensus expectation of just 59,000 — a meaningful beat that offers some reassurance after a rocky start to the year. The Healthcare sector continued to be a standout, contributing 76,000 positions, likely benefiting from the resolution of the strike by Kaiser Permanente workers in California and Hawaii. Strength was seen across industries, with construction and leisure and hospitality payrolls rising following declines in February. On average, payrolls rose 68,000 in the first three months of this year, after factoring in sharp revisions to prior months reports.
Wage growth moderated to 0.2% month-over-month, with the year-over-year pace slowing to 3.5%, a trend that should be constructive for the inflation outlook. While the unemployment rate ticked down to 4.3% from 4.4%, long-term unemployment has risen by 322,000 over the past year to 1.8 million, a quiet but important signal that re-employment is becoming more difficult for a segment of the workforce.
On balance, the March report is encouraging at the surface level, but the persistent reliance on a single sector, downward revisions to prior months, and rising long-term unemployment suggest the labor market is softening in ways the headline number does not fully capture.
Growth is Slowing, not Stalling
With the labor market showing signs of gradual cooling rather than outright deterioration, attention has increasingly shifted to the broader growth outlook. The Atlanta Fed’s GDPNow model currently estimates first quarter real GDP growth at approximately 1.6 percent, down from earlier readings as softer consumption data and a widening trade deficit have weighed on the calculation. GDPNow is best understood as a real time accounting exercise rather than a traditional forecast. It mechanically aggregates incoming data using a framework similar to the Bureau of Economic Analysis, with no judgment or forward looking assumptions applied.
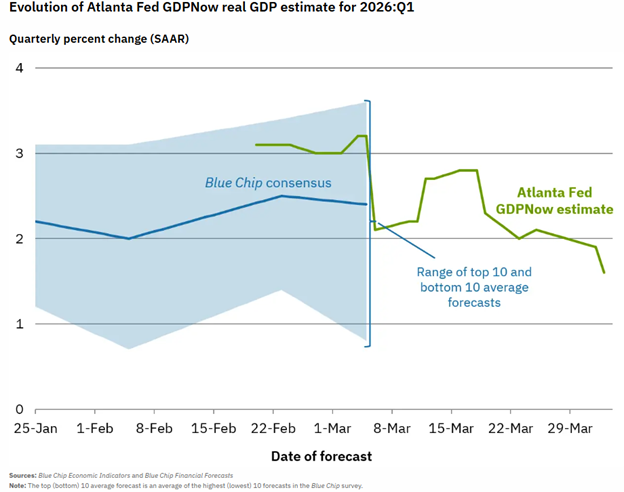
That makes it useful for tracking how reported data are shaping the quarter as it unfolds, but also inherently volatile, particularly earlier in the quarter when key components such as net exports and inventories can swing sharply on limited information. As a result, GDPNow tends to capture direction better than precision and often converges toward the final GDP estimate only as the quarter closes. In the current environment, the model’s moderation in growth is consistent with an economy that is slowing but still expanding. It should be viewed as a signal, not a verdict, and interpreted alongside broader indicators of demand, income growth, and financial conditions rather than in isolation.
A Historic Defense Buildup and Its Economic Implications
Fiscal policy has also moved back into focus following the release of the administration’s proposed $1.5 trillion defense budget, the largest nominal defense request in U.S. history. The proposal represents roughly a 40–42% increase from the prior year’s defense spending level, which had already reached record territory near $1.0–$1.05 trillion after supplemental funding, marking one of the sharpest year over year increases outside of major wartime buildups.
In real dollars, the increase rivals the pace of defense spending accelerations seen during the Reagan military buildup of the early 1980s and, as a share of GDP, begins to approach levels last observed during periods of sustained geopolitical confrontation, though still well below Cold War and World War II extremes.
From a growth perspective, higher defense spending provides a near term tailwind through government outlays, industrial production, and employment in defense related sectors, particularly shipbuilding, munitions, aerospace, and advanced manufacturing. At the same time, the macro impact should be viewed in context. Defense spending tends to be capital intensive, unevenly distributed over time, and often offset by reductions elsewhere in the budget. As a result, while the proposal adds support to aggregate demand and reduces downside growth risk in the near term, it is unlikely on its own to meaningfully alter the broader trajectory of economic growth without sustained spillovers into private sector investment and productivity.
Looking Ahead
Taken together, March’s volatility reflects a market adjusting to a changing risk landscape rather than a breakdown in underlying fundamentals. Geopolitical uncertainty, shifting expectations for monetary policy, and slowing but still‑positive growth have narrowed the margin for error, but they have not altered the long‑term investment case. History suggests that periods like this reward discipline over reaction and patience over prediction. While near‑term uncertainty is likely to persist, portfolios built with appropriate diversification, risk management, and a long‑term perspective remain well positioned to navigate an environment defined more by noise than by deterioration.
Thank you for your continued confidence in our team, and please reach out with any questions you may have. It is our pleasure to share life’s journey with you.
Market Commentary Disclosures
*Magnificent Seven: The term "Magnificent Seven" was coined by others and should not be construed as an endorsement or indicator of any stock or company's quality.
This document is a general communication being provided for informational purposes only. It is educational in nature and not designed to be taken as advice or a recommendation for any specific investment product, strategy, plan feature or other purpose in any jurisdiction, nor is it a commitment from Towne Trust to participate in any of the transactions mentioned herein. Any examples used are generic, hypothetical and for illustration purposes only. This material does not contain sufficient information to support an investment decision and it should not be relied upon by you in evaluating the merits of investing in any securities or products. In addition, users should make an independent assessment of the legal, regulatory, tax, credit, and accounting implications and determine, together with their own financial professional, if any investment mentioned herein is believed to be appropriate to their personal goals. Investors should ensure that they obtain all available relevant information before making any investment. Any forecasts, figures, opinions or investment techniques and strategies set out are for information purposes only, based on certain assumptions and current market conditions as of the date given and are subject to change without prior notice. All information presented herein is considered to be accurate at the time of production, but no warranty of accuracy is given and no liability in respect of any error or omission is accepted. It should be noted that investment involves risks, the value of investments and the income from them may fluctuate in accordance with market conditions and taxation agreements and investors may not get back the full amount invested. Neither past performance or yields are reliable indicators of current and future results.
Stock investments involve risk, including loss of principal. High-quality stocks may be appropriate for some investment strategies. Ensure that your investment objectives, time horizon and risk tolerance are aligned with investing in stocks, as they can lose value. Although we define “high quality” stocks as having high and stable profitability (return on equity, earnings variability) the term “high quality” is not a recommendation for any specific investment as stocks may not be appropriate for some investment strategies.
There are risks associated with fixed-income investments, including credit risk, interest rate risk, and prepayment and extension risk. In general, bond prices rise when interest rates fall and vice versa. This effect is usually more pronounced for longer term securities. A rise in interest rates may result in a price decline of fixed-income instruments held by the fund, negatively impacting its performance and NAV. Falling rates may result in the fund investing in lower yielding debt instruments, lowering the fund’s income and yield. These risks may be heightened for longer maturity and duration securities.
Towne Trust, its affiliates and/or their respective officers, directors or employees may from time to time acquire, hold or sell securities mentioned herein.
Not FDIC Insured • May Lose Value • Not Bank Guaranteed • Not a Deposit
Index Definitions
Dow Jones Industrial Average: The Dow Jones Industrial Average is a price-weighted average of the 30 blue chip stocks that are generally the leaders in their industry. It has been widely followed indicator of the stock market since October 1, 1928.
NASDAQ Composite Index: The NASDAQ Composite Index is a broad-based capitalization-weighted index of stocks in all three NASDAQ tiers: Global Select, Global Market and Capital Market. The index was developed with a base level of 100 as of February 5, 1971.
Russell 2000 Index: The Russell 100 Index is comprised of the smallest 2,000 companies in the Russell 1000 Index, representing approximately 8% of the Russell 3000 total market capitalization. The real-time value is calculated with a base value of 135.00 as of December 31, 1986. The end-of-day value is calculated with a base value of 100.00 as of December 19,1978.
S&P 500 Index: The S&P 500 Index is widely regarded as the best single gauge of large-cap U.S. equities and serves as the foundation for a wide range of investment products. The index includes 500 leading companies and captures approximately 80% coverage of the available market capitalization.
MSCI Emerging Markets Index: The MSCI EM (Emerging Markets) Index is a free-float weighted equity index that captures large and mid-cap representation across Emerging Markets (EM) countries. The index covers approximately 85% of the free float-adjusted market capitalization in the each country.
U.S. Aggregate: The Bloomberg USAgg Index is a broad-based flagship benchmark that measures the investment grade, US dollar-denominated, fixed-rate taxable bond market. The index includes Treasuries, government-related and corporate securities, MBS (Agency fixed-rate pass-through), ABS and CMBS (agency and non-agency). (Future Ticker: I00001US)
MSCI ACWI Excluding United States Index: The MSCI AC World ex USA Index is a free-float weighted equity index. It was developed with a base value of 100 as of December 31, 1987.
About the Author